← Live courses
LiveEnglishIntermediateZoomAI agentsExcel + iziRisk Quantum

Credit risk quantification: losses, capital and stochastic RAROC with AI agents

With Fernando Hernández. Six two-hour sessions to model the losses of a credit portfolio with stochastic EAD, PD and LGD, calculate its economic capital and decide with RAROC which sub-portfolios create value.

  1. Tue17Nov
  2. Thu19Nov
  3. Tue24Nov
  4. Tue1Dec
  5. Thu3Dec
  6. Thu10Dec
6 sessions · 12 hours12:00–14:00 New York · 17:00–19:00 London · 09:00–11:00 Los Angeles
  • ✓ 6 live sessions on Zoom, and their recordings
  • ✓ 3 months of the Professional licence: the credit RAROC model with your own data, the AI agents, the iziRisk Quantum Excel add-in and the downloadable materials · What's in it?
  • ✓ The credit risk and RAROC Excel workbook, the 5,000-loan demo portfolio and its payment history, in five languages

US$240US$340

Launch price until 6 November

By the end you will be able to

  • ✓Explain why a credit portfolio’s loss is a random variable, and tell apart the expected loss, which pricing covers, from the unexpected loss, which capital covers.
  • ✓Break the loss into EAD × PD × LGD and model each factor with its distribution: Bernoulli for default, PERT or Beta for severity, and triangular, lognormal or normal for exposure.
  • ✓Estimate the PD of each delinquency state from payment histories with transition matrices, by the duration and cohort methods, and judge how much evidence stands behind each PD.
  • ✓Add systematic risk and the correlations between EAD, PD and LGD and across segments, and show why ignoring them understates economic capital.
  • ✓Calculate economic capital at a confidence level, allocate it across sub-portfolios by their contribution to the tail and measure the diversification benefit.
  • ✓Build RAROC from income, funding cost and fixed and variable operating costs, and apply the decision rules against the hurdle rate — mean RAROC, RAROC P5 and the probability of clearing it — alongside EVA.
  • ✓Break risk and return down by sub-portfolio, sector, region, branch or any other dimension of the loan tape, and reproduce the model in Excel with iziRisk Quantum.
  • ✓Work with the AI agent that interprets the results and drafts the report for the credit committee, and review what it proposes with judgement.

Who it is for

Credit risk analysts and managers, portfolio managers, finance, treasury and ALM teams, audit and model validation, and supervisors. Also cooperatives, microfinance institutions and fintechs that need to measure the capital their portfolio consumes.

Prerequisites

Intermediate Excel and familiarity with the basics of a loan: balance, rate, delinquency and collateral. No advanced statistics or programming needed.

Includes

  • 6 live sessions on Zoom, and their recordings.
  • 3 months of the Professional licence: the credit RAROC model with your own data, the AI agents, the iziRisk Quantum Excel add-in and the downloadable materials.
    › What's in it?

    Stochastic credit RAROC model

    • Your own loan tape and payment histories, not just the demo portfolio (locked on the Student account).
    • Correlated risk factors between EAD, PD and LGD and across segments (locked on the Student account).
    • Simulations of up to 200,000 iterations, against 200 on the Student account.
    • Transition-matrix estimation from payment histories, by duration and by cohorts.
    • Export of the model to Excel (.xlsm) and a PDF report with charts and analysis.

    AI agents

    • Analyse every portfolio simulation and explain it in plain language for the credit committee.
    • Build Excel Monte Carlo models and turn a deterministic Excel model into a probabilistic one (“Just iziRisk it!”).
    • Generous use: over a hundred analyses a month, against a few in total on the Student account.

    Excel and materials

    • The iziRisk Quantum Excel add-in with up to 50,000 iterations per simulation, distribution fitting and a correlation matrix.
    • Unlimited downloads of course materials: PDFs, workbooks and resources.

    Experts

    • The “Ask the Expert” AI chat, answered from indexed expert content.
    • Up to 30 questions a month to human experts.
    See the full Professional plan →
  • The credit risk and RAROC Excel workbook, the 5,000-loan demo portfolio and its payment history, in five languages.
  • Certificate of 12 hours of training.

Minimum 8, maximum 25 participants.
Dates and times · 6 sessions, 12 hours

  1. SESSION 1

    Tuesday 17 November

    12:00–14:00 New York

    Loss is a random variable: expected loss, unexpected loss and capital

    A portfolio does not lose its expected loss: it loses something different every year, and the bad years are the ones that consume capital. This session moves from the deterministic loss formula to its distribution, which is where capital and RAROC come from.

    • Loss = EAD × PD × LGD: what each factor measures and why all three are uncertain.
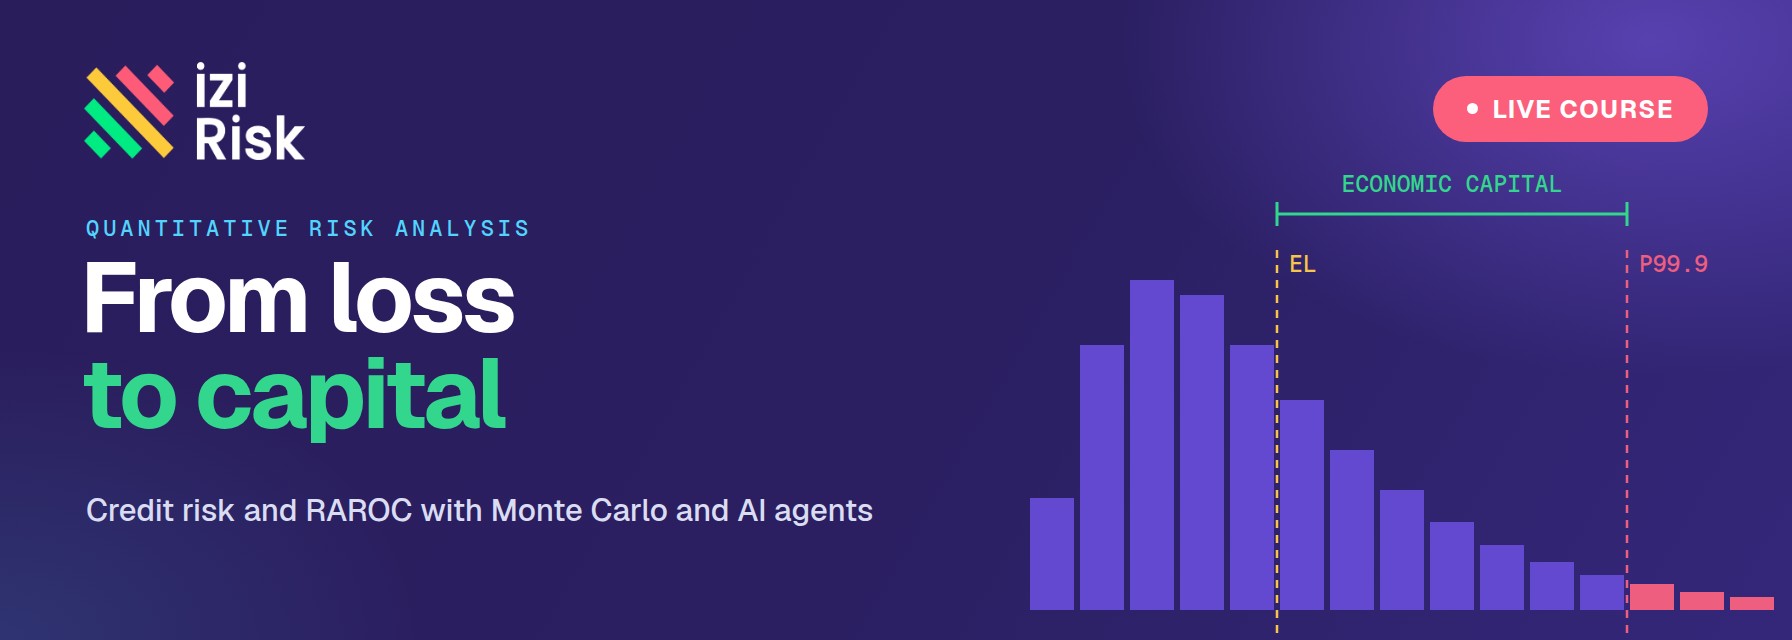
    • Expected loss, unexpected loss and the percentile that defines economic capital.
    • Monte Carlo explained without formulas: one year of the portfolio per iteration, with a Bernoulli per loan for default.
    • The loan tape: which columns the model needs and which become dimensions of analysis.
    • What iziRisk’s AI agents do in credit risk analysis.

    Hands-on: Load the 5,000-loan demo portfolio, run the first simulation and read the loss distribution.

  2. SESSION 2

    Thursday 19 November

    12:00–14:00 New York

    Probability of default: delinquency states and transition matrices

    • Ratings and delinquency states: current, 1-30, 31-60, 61-90, over 90 days and defaulted.
    • The one-year transition matrix and the PD of each state.
    • Estimating it from payment histories: the duration method (hazard rates and the matrix exponential) against the cohort method.
    • Horizons beyond one year, customers who leave the file, and the confidence band around each PD.

    Hands-on: Estimate the matrix from the demo payment history, compare it with the Excel workbook’s and apply it to the portfolio.

  3. SESSION 3

    Tuesday 24 November

    12:00–14:00 New York

    Severity, exposure and correlation: why diversification deceives

    If defaults were independent, a large portfolio would need almost no capital. They are not: in a recession the PDs of every segment rise together and collateral loses value exactly when it is needed most. This session completes the three factors of the loss and puts numbers on that difference.

    • LGD as a bounded share: PERT by collateral type and the Beta distribution. Why the expected LGD is not the most likely one, and how much using the mode understates the loss.
    • EAD: undrawn lines, amortisation and the choice between triangular, lognormal and normal.
    • Idiosyncratic versus systematic risk: segment factors and the volatility of PD and LGD with a Beta distribution.
    • Spearman correlations between EAD, PD and LGD, and across segments, with Iman–Conover.
    • How much capital the independence assumption hides.

    Hands-on: Calibrate the LGD table by collateral and simulate the portfolio with and without correlations: explain the effect of each step on expected loss and on economic capital.

  4. SESSION 4

    Tuesday 1 December

    12:00–14:00 New York

    Economic capital, allocation and RAROC

    • Economic capital at 99.9%: the loss at the percentile minus the expected loss.
    • Standalone capital versus capital allocated by contribution to the tail, and the diversification benefit.
    • Income, funding cost by currency and costly liabilities, fixed and variable operating costs, and cost per loan.
    • RAROC, EVA and the hurdle rate. The three decision rules: mean RAROC, RAROC P5 and the probability of clearing the hurdle.
    • Breakdowns by sub-portfolio, sector, region and branch, and what drives RAROC.

    Hands-on: Find which sub-portfolios and regions destroy value and the lever for each: price, origination, collateral or costs.

  5. SESSION 5

    Thursday 3 December

    12:00–14:00 New York

    The model in Excel with iziRisk Quantum

    • From the web model to the .xlsm workbook: the Model, Dataset and Ref sheets.
    • IZBERNOULLI, IZPERT and IZBETA loan by loan, and the segment factors as inputs.
    • Inputs, outputs and correlations already declared: simulate, chart and read the tornado in Excel.
    • Reconciling the Excel results with the web model’s.
    • Adapting the workbook to your own portfolio.

    Hands-on: Export the portfolio, simulate it in Excel and reconcile expected loss, capital and RAROC with the web model.

  6. SESSION 6

    Thursday 10 December

    12:00–14:00 New York

    Validating, deciding and presenting to the credit committee

    • Model validation: expected loss against history, back-testing with crisis years and stability across seeds.
    • Reproducibility: seeds, iterations, Latin Hypercube and convergence. How to document every assumption so a validator can review it.
    • The most common mistakes in credit loss models.
    • What to report to the committee, what not to, and how to tell it to the person who decides. The AI agent that analyses the simulation and the PDF report, without handing it the judgement.
    • Clinic: volunteers present their portfolio and get feedback. Wrap-up and certificates.

    Hands-on: The one-page report for the credit committee on your own portfolio or the demo portfolio.

Ask a question